
Institutional investors may overlook SB Financial Group, Inc.'s (NASDAQ:SBFG) recent US$16m market cap drop as long-term gains remain positive
Key Insights
- Significantly high institutional ownership implies SB Financial Group's stock price is sensitive to their trading actions
- 51% of the business is held by the top 11 shareholders
- Insiders have bought recently
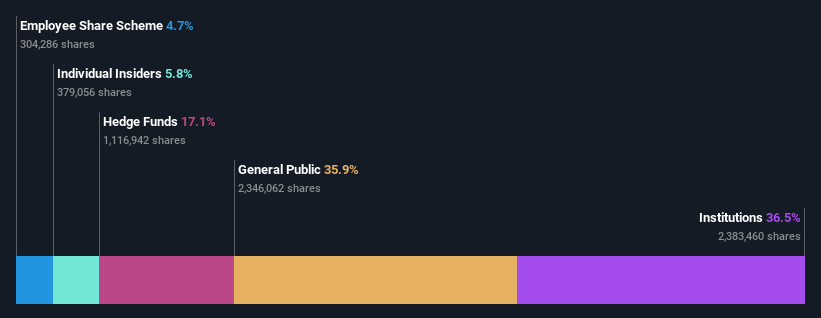
To get a sense of who is truly in control of SB Financial Group, Inc. (NASDAQ:SBFG), it is important to understand the ownership structure of the business. And the group that holds the biggest piece of the pie are institutions with 37% ownership. In other words, the group stands to gain the most (or lose the most) from their investment into the company.
Institutional investors endured the highest losses after the company's market cap fell by US$16m last week. However, the 39% one-year return to shareholders might have softened the blow. They should, however, be mindful of further losses in the future.
Let's delve deeper into each type of owner of SB Financial Group, beginning with the chart below.
View our latest analysis for SB Financial Group
What Does The Institutional Ownership Tell Us About SB Financial Group?
Many institutions measure their performance against an index that approximates the local market. So they usually pay more attention to companies that are included in major indices.
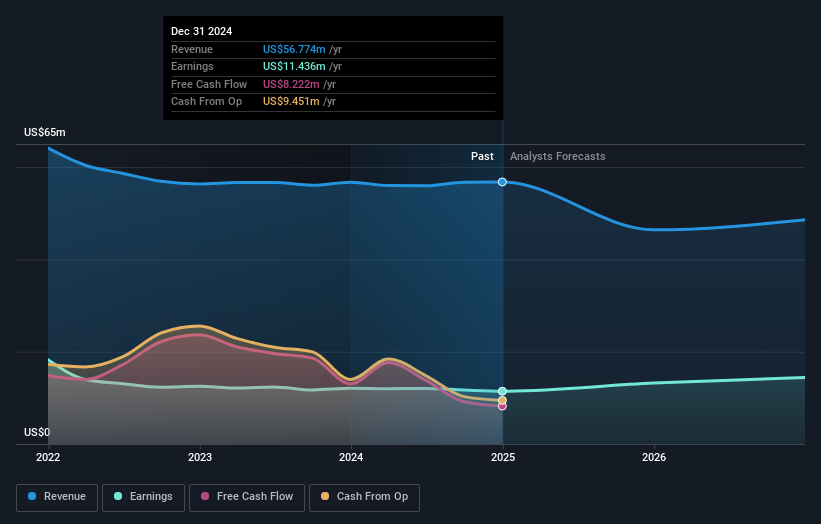
SB Financial Group already has institutions on the share registry. Indeed, they own a respectable stake in the company. This can indicate that the company has a certain degree of credibility in the investment community. However, it is best to be wary of relying on the supposed validation that comes with institutional investors. They too, get it wrong sometimes. When multiple institutions own a stock, there's always a risk that they are in a 'crowded trade'. When such a trade goes wrong, multiple parties may compete to sell stock fast. This risk is higher in a company without a history of growth. You can see SB Financial Group's historic earnings and revenue below, but keep in mind there's always more to the story.
Our data indicates that hedge funds own 17% of SB Financial Group. That catches my attention because hedge funds sometimes try to influence management, or bring about changes that will create near term value for shareholders. Our data shows that Manulife Asset Management is the largest shareholder with 7.4% of shares outstanding. Meanwhile, the second and third largest shareholders, hold 7.2% and 6.0%, of the shares outstanding, respectively. Furthermore, CEO Mark Klein is the owner of 1.8% of the company's shares.
A closer look at our ownership figures suggests that the top 11 shareholders have a combined ownership of 51% implying that no single shareholder has a majority.
While studying institutional ownership for a company can add value to your research, it is also a good practice to research analyst recommendations to get a deeper understand of a stock's expected performance. There is some analyst coverage of the stock, but it could still become more well known, with time.
Insider Ownership Of SB Financial Group
The definition of company insiders can be subjective and does vary between jurisdictions. Our data reflects individual insiders, capturing board members at the very least. The company management answer to the board and the latter should represent the interests of shareholders. Notably, sometimes top-level managers are on the board themselves.
Most consider insider ownership a positive because it can indicate the board is well aligned with other shareholders. However, on some occasions too much power is concentrated within this group.
We can report that insiders do own shares in SB Financial Group, Inc.. As individuals, the insiders collectively own US$7.3m worth of the US$126m company. It is good to see some investment by insiders, but we usually like to see higher insider holdings. It might be worth checking if those insiders have been buying.
General Public Ownership
The general public-- including retail investors -- own 36% stake in the company, and hence can't easily be ignored. While this size of ownership may not be enough to sway a policy decision in their favour, they can still make a collective impact on company policies.
Next Steps:
I find it very interesting to look at who exactly owns a company. But to truly gain insight, we need to consider other information, too.
Many find it useful to take an in depth look at how a company has performed in the past. You can access this detailed graph of past earnings, revenue and cash flow .
If you would prefer discover what analysts are predicting in terms of future growth, do not miss this free report on analyst forecasts .
NB: Figures in this article are calculated using data from the last twelve months, which refer to the 12-month period ending on the last date of the month the financial statement is dated. This may not be consistent with full year annual report figures.
Have feedback on this article? Concerned about the content? Get in touch with us directly. Alternatively, email editorial-team (at) simplywallst.com.
This article by Simply Wall St is general in nature. We provide commentary based on historical data and analyst forecasts only using an unbiased methodology and our articles are not intended to be financial advice. It does not constitute a recommendation to buy or sell any stock, and does not take account of your objectives, or your financial situation. We aim to bring you long-term focused analysis driven by fundamental data. Note that our analysis may not factor in the latest price-sensitive company announcements or qualitative material. Simply Wall St has no position in any stocks mentioned.